
Charleston, SC – This year’s Charleston Race Week was highlighted by several weather features complements of SailFlow.
 Wind Meters: Using
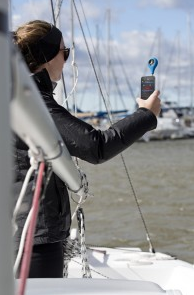
  WeatherFlow’s popular smart phone wind meters, each chase boat for the regatta was able to provide real-time wind measurements from the marks on the course. With a single click in the wind meter app, the chase boat drivers could submit their reports to SailFlow along with any additional information they observed (wave heights, gust factors, shiftiness of the winds, currents, etc..), and those readings were then available via the Onsite Reports map on SailFlow website and mobile applications. This provided the race committee and competitors unparalleled real time conditions for making better decisions for the event.
 Flowview: In addition to providing the wind meters and free and premium WeatherFlow station data for the event, SailFlow also provided Flowview, a full screen web view that updates in real time to display local observations, Meteorologist Forecasts, Radar, model forecasts data, tidal currents, and much more. Flowview automatically refreshes to keep the data current and will run on any size monitor and simply needs an internet connected computer.
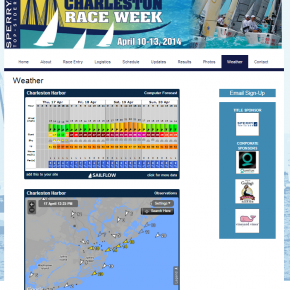 Widgets: Using SailFlow’s custom widgets, the event webmaster easily embedded precision model forecasts and real time data from around the area as a powerful tool for all participants. These widgets are still in place and can be used for anyone, anytime, not just for the race period.
Have an event coming up? What can WeatherFlow do for you?