
We humans love to look at the clouds and imagine seeing shapes of people, creatures of all kinds, and other familiar stuff. What do you “see” when you look at this image?

The first time I looked at it, I “saw” a face, with eyes, a nose, and a mouth. Perhaps you see a different image. Perhaps nothing at all…just a bunch of clouds. But what are we really seeing? To answer that question, we need to understand: What a cloud is made of? How does it form?
What is a cloud made of?
Simply, it’s a visible mass of water droplets or ice particles. The word “visible” is important here. Our atmosphere contains lots of moisture we don’t see – because it’s in gas form – known as water vapor. At any given time, air all over the planet has varying amounts of water vapor.
How does a cloud form?
First, we need a process to convert that atmospheric water vapor (gas) to a liquid (water droplets). That process is called condensation, and it occurs when air is cooled down.
One way to think about it is that, in warmer air, the water vapor molecules move around quickly and rarely touch. As the air cools, the molecules slow down and begin to “stick” together and form droplets.
Fortunately, we have a simple experiment to demonstrate the process of condensation. (Science teachers love this one, so there is a good chance you have seen it in class – or perhaps for a home assignment). The classic way of demonstrating condensation is by filling a glass with ice water and placing it on a counter. Note: Don’t ever do this on furniture. It does not make adult people happy!

Meteorologists are always on the lookout for mechanisms in the atmosphere that can cause air to cool down, resulting in clouds and sometimes precipitation – depending on the amount of water vapor in the air. For example, since we know that it’s generally colder as you go higher into the atmosphere, we look for mechanisms that lift the air to higher altitudes. Some of these are:
- Heat from the sun warms the ground and air in contact with it. As we know, hot air rises.
- Winds blowing moist air against a mountain, forcing the air to rise up the mountain.
- When two air masses come together, one is typically cooler and denser than the other. In that case, the cooler one may wedge under the warmer one and force it up higher in the atmosphere – cooling down its air particles.
There are other mechanisms, but you get the idea! All this rising and sinking (cooling and heating) of air particles happens constantly and at all levels in our atmosphere. So, it stands to reason that clouds would be located throughout the atmosphere as well. And they are…
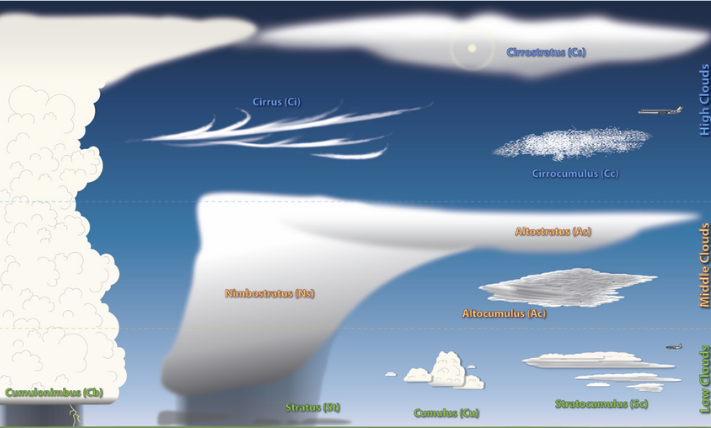
Note how we divide the atmosphere into three levels – low, middle, and high. We describe clouds as being middle-level altocumulus or low-level cumulus, as examples. So, now we know that each of these ten types of clouds has a name and an altitude range in which they form and extend into. Keeping in mind there are variations, here’s how they generally look:
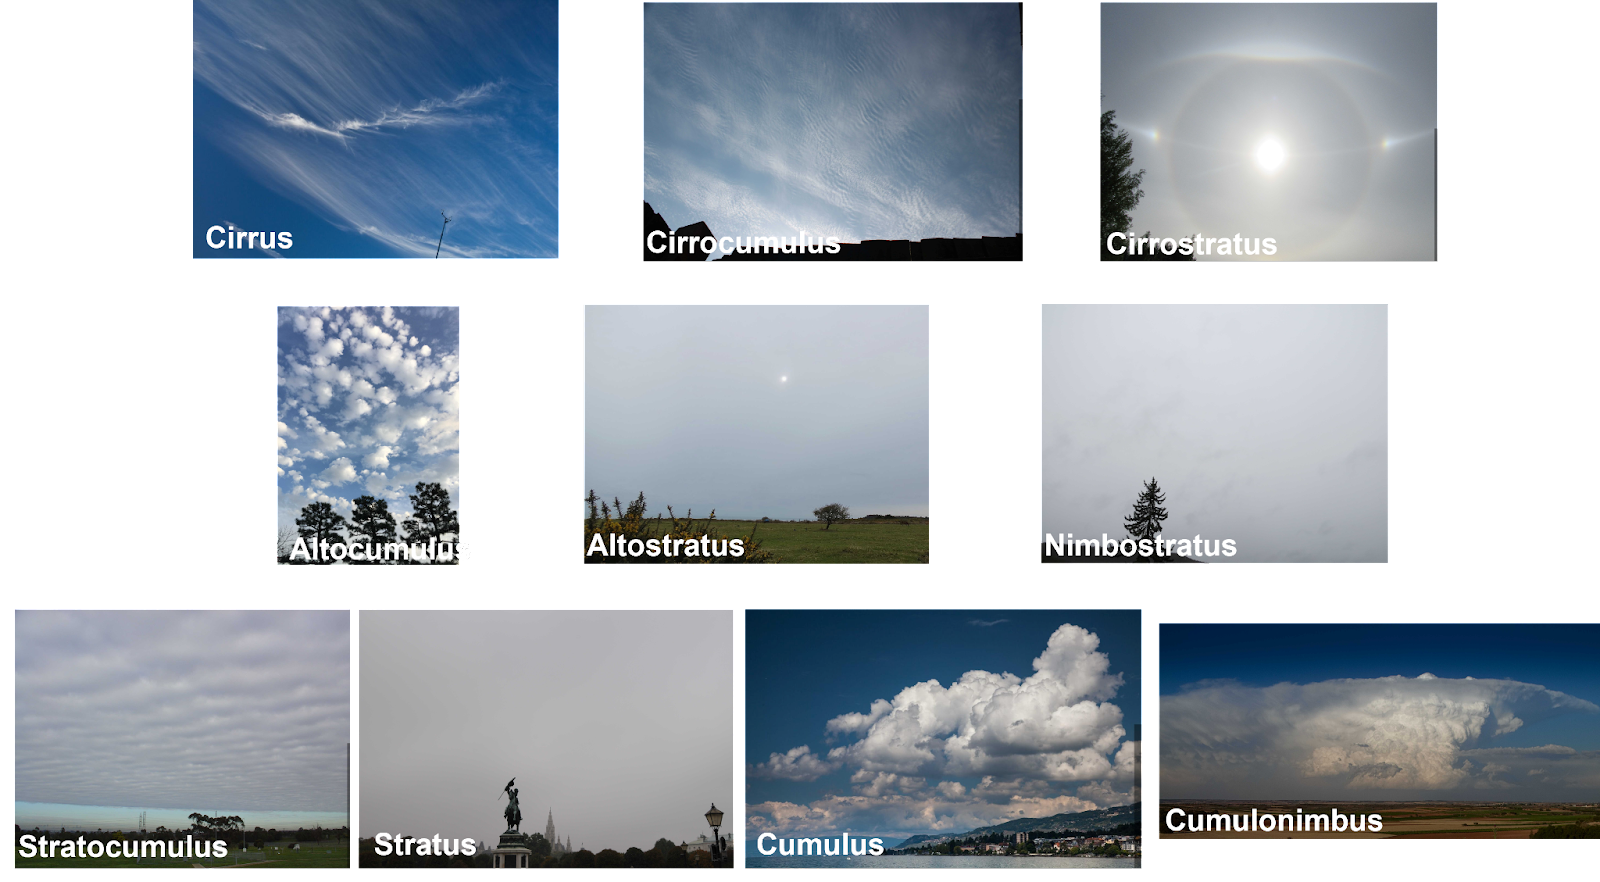
As you look at these cloud images, here’s a good rule of thumb: The cloud names with “stratus” in them (Nimbostratus, Stratus…) produce a generally steady rain that covers a large area and lasts longer. It may be heavy, moderate, or light. The cloud names with “cumulus” in them (Cumulus, Cumulonimbus…) will produce showers. These cover smaller areas, last a shorter amount of time, and are more difficult to predict for a specific location. Thunderstorms are included in this group (Cumulonimbus).
Meteorologists are trained to observe the weather, and clouds are one of several observable parameters, along with winds, temperature, rain, lightning, etc. It takes some practice to correctly identify cloud types, but with a bit of practice, it’s quite doable.
Putting our cloud knowledge to work
As I mentioned, it takes practice to identify cloud types. A fair question might be: Why do we care? One answer is that clouds help us forecast the weather. By keeping track of the changes, we get a sense of changing weather patterns.
For example, let’s say we want to meet our friends at the skate park on Saturday and hope not to be rained out. We also know (trust me) that it’s mostly those low-level clouds that bring rain. So, early in the week, we start watching for changes in the clouds over a few days.
On Tuesday, we note that the sky is clear. No clouds. We can assume the atmosphere is relatively dry (water vapor levels are low) and there’s not much condensation happening. That’s a good start!
On Wednesday, we start seeing wisps of cirrus (remember, this is in the upper level of the atmosphere). We know that something has changed to introduce moisture way up there. It’s time to pay closer attention to the next few days.
On Thursday, those high-level clouds start to thicken, and we believe we see cirrostratus clouds. Sometimes people call it a sort of milky appearance. We have evidence that moisture is increasing. Still, it’s way up in the atmosphere and those high clouds don’t bring rain. No sweat.
By Friday, we notice a big change. Instead of just high-level clouds, we start to see mid-level altocumulus clouds. Moisture has worked its way closer to the ground and the condensation process is getting lower in the atmosphere. We might also notice that the wind has increased a bit. The trend is definitely towards lowering clouds and more moisture. Rain for tomorrow? Ugh! Hope not.
When you wake up on Saturday, the sky is gray and low-level stratocumulus clouds cover the sky. Winds have increased and rain looks like it could happen at any time. But you know that stratocumulus clouds typically don’t produce rain and, if they do, the rain is light. (Trust me, again) So, you text your friends to meet at the skatepark, despite the dark clouds.
Cloud activity
A great activity for learning how to anticipate rainy weather is to use our Tempest Weather System, along with our eyes, to observe current weather parameters, look at the trends over time and forecast what we think may happen over the next few hours to days. We can then compare our forecast with our Tempest’s forecast.
Looking at trends is most important. If parameters are already changing over time perhaps we can make some assumptions about the future. Here’s an example from a Tempest Weather Station as I write this blog: First, the current observation (what’s happening now).
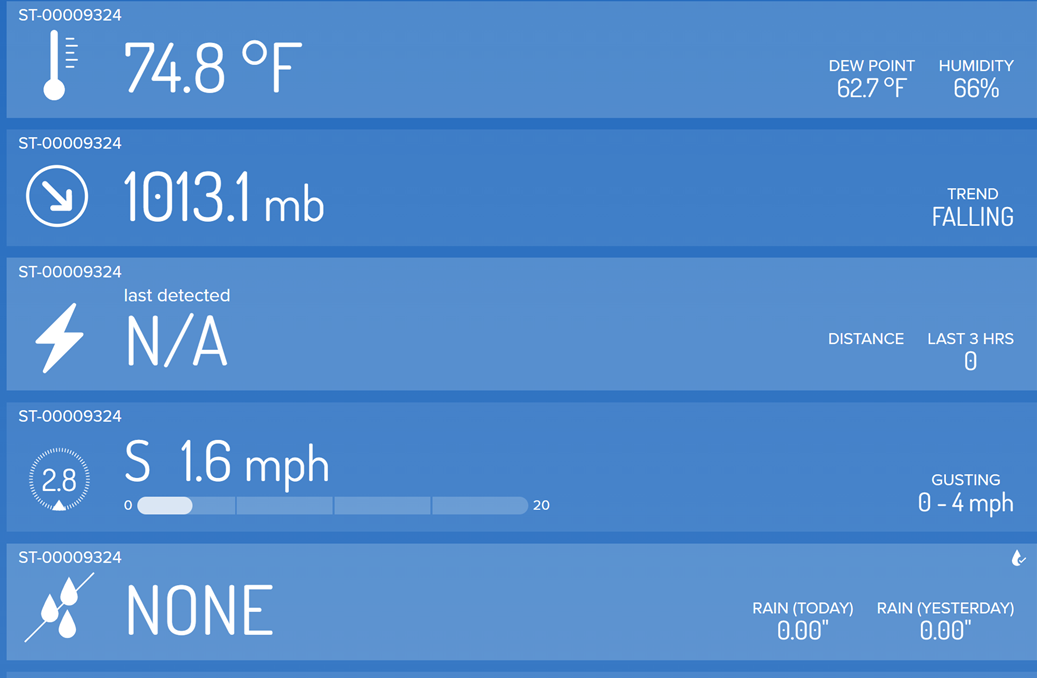
As we look at the values, we notice right away that Tempest is telling us that the pressure is falling. That is frequently (although not always) an indication that storminess may be on the way. Here’s what the Tempest Pressure trend graph looks like:
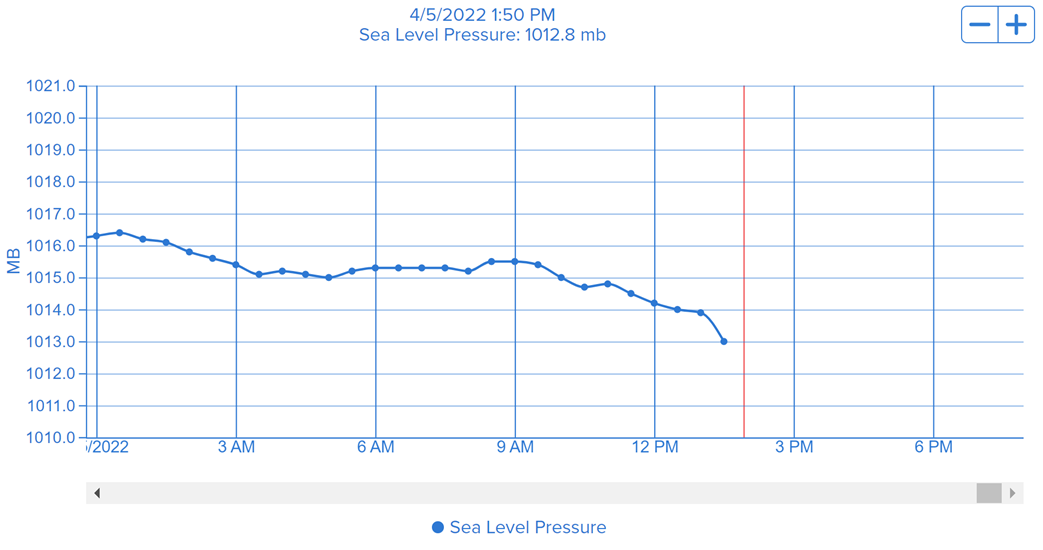
As you can see from the graph, pressure has been dropping all day but now dropping faster. Now it’s time to go outside and check on the cloud conditions. What started out as a sunny morning now has the hazy, gray look of Cirrostratus clouds – an indication that atmospheric moisture is building. We begin to think we have some precipitation on the way. Let’s see what our Tempest forecast shows:
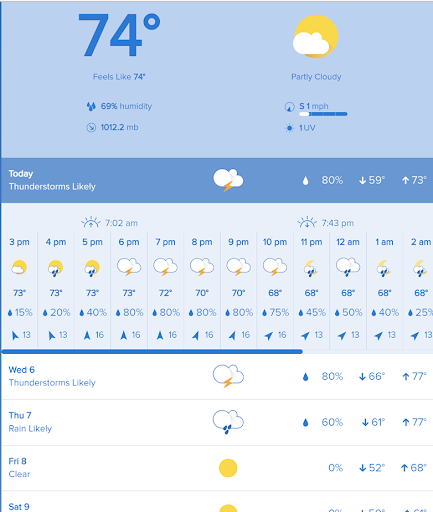
Based on what we observe and the trend towards lower pressure and increasing clouds, we can have a bit more confidence in the Tempest forecast. Note also that the Tempest forecast is calling for Thunderstorms. Let’s go back to our Tempest a couple of hours later and see if it has sensed any lightning or rain.
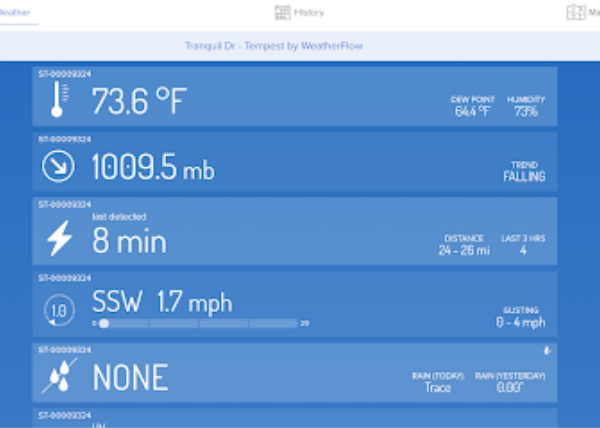
Our Tempest sensor update now shows continued falling pressure, lightning, and a trace (less than .01 inches) of rain. You have a wealth of information available through your Tempest Weather Station and a new understanding of cloud types and how they indicate moisture in the atmosphere. With a little practice, you are on your way to making informed decisions about the impact of the weather on your day-to-day life.